perfsonar-user - [perfsonar-user] help with maddash-config
Subject: perfSONAR User Q&A and Other Discussion
List archive
- From: Joël COSTAMAGNA <>
- To:
- Subject: [perfsonar-user] help with maddash-config
- Date: Thu, 27 Feb 2020 15:21:45 +0000
- Organization: IMERIR
Hi,
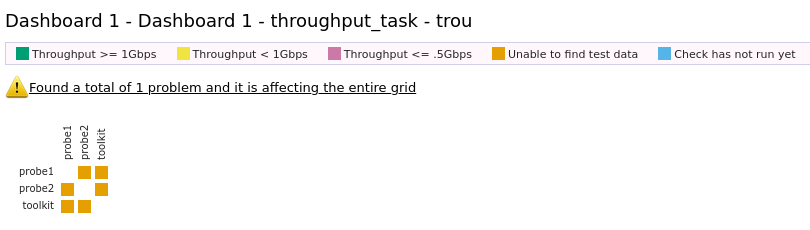
I am having troubles with configuring the grid for maddash, I am
trying to have a simple throughput test between my toolkit and the
two probes and display it in maddash grid. I set up the tests in a
template and used the psconfig remote to run it, i can see the
tests running in the journalctl in my probe but the maddash grid
says no data available. I don't know where to look to check if the
data is sent in the database on the maddash host
here is my template.json:
{ "addresses": {
    "probe1": {
        "address": "172.16.XX.01"
    },
    "probe2": {
        "address": "172.16.XX.02"
    },
    "toolkit": {
        "address": "172.16.XX.03"
    }
},

"groups": {
       "throughput_group": {
           "type": "mesh",
           "addresses": [
                {"name": "probe1"},
                {"name": "probe2"},
                {"name": "toolkit"}
            ]
       }
},
"tests": {
    "latency_test": {
        "type": "latencybg",
        "spec": {
            "source": "{% address[0] %}",
            "dest": "{% address[1] %}",
            "packet-interval": 0.1,
            "packet-count": 600
        }
    },
    "throughput_test": {
        "type": "throughput",
        "spec": {
            "source": "{% address[0] %}",
                    "dest": "{% address[1] %}",
            "duration": "PT30S"
        }
    }
},
"schedules": {
   "every_4_hours": {
        "repeat": "PT4H",
        "slip": "PT4H",
        "sliprand": true
    },
   "every_2_hours": {
        "repeat": "PT2H",
        "slip": "PT2H",
        "sliprand": true
    },
    "every_ten_min": {
    "repeat": "PT10M",
    "slip": "PT10M",
    "sliprand": true
    }
},

"archives": {
   "esmond_archive": {
        "archiver": "esmond",
        "data": {
            "url": "https://172.16.XX.YY/esmond/perfsonar/archive",
            "measurement-agent": "{% scheduled_by_address %}"
        }
    }
},

"tasks": {
"latency_task": {
        "group": "throughput_group",
        "test": "latency_test",
        "archives": ["esmond_archive"]
    },
"throughput_task": {
        "group": "throughput_group",
        "test": "throughput_test",
        "archives": ["esmond_archive"],
        "schedule": "every_ten_min"
    }

}

}
and the maddash-grid config:
{
"trou" : {
"check" : {
"params" : {
"time-range" : 604800
},
"type" : "ps-nagios-throughput"
},
"visualization" : {
"type" : "ps-graphs"
},
"display-name" : "trou"
},
"latency" : {
"check" : {
"type" : "ps-nagios-ping-loss"
},
"visualization" : {
"type" : "ps-graphs"
},
"display-name" : "latency"
}
}


thanks for your help !

Regards,
joel costamagna
- [perfsonar-user] Problem with Persfonar firewall ports, Raul Lopes, 02/21/2020
- Re: [perfsonar-user] Problem with Persfonar firewall ports, Szymon Trocha, 02/24/2020
- Re: [perfsonar-user] Problem with Persfonar firewall ports, Raul Lopes, 02/24/2020
- Re: [perfsonar-user] Problem with Persfonar firewall ports, Szymon Trocha, 02/24/2020
- Re: [perfsonar-user] Problem with Persfonar firewall ports, Raul Lopes, 02/24/2020
- Message not available
- Message not available
- Message not available
- Message not available
- Message not available
- Re: [perfsonar-user] Problem with Persfonar firewall ports, Raul Lopes, 02/25/2020
- Re: [perfsonar-user] Problem with Persfonar firewall ports, Raul Lopes, 02/25/2020
- Re: [perfsonar-user] Problem with Persfonar firewall ports, Mark Feit, 02/27/2020
- Re: [perfsonar-user] Problem with Persfonar firewall ports, Raul Lopes, 02/27/2020
- [perfsonar-user] help with maddash-config, Joël COSTAMAGNA, 02/27/2020
- Re: [perfsonar-user] help with maddash-config, Szymon Trocha, 02/28/2020
- Re: [perfsonar-user] Problem with Persfonar firewall ports, Mark Feit, 02/27/2020
- Re: [perfsonar-user] Problem with Persfonar firewall ports, Raul Lopes, 02/28/2020
- Message not available
- Message not available
- Re: [perfsonar-user] Problem with Persfonar firewall ports, Raul Lopes, 02/24/2020
- Re: [perfsonar-user] Problem with Persfonar firewall ports, Szymon Trocha, 02/24/2020
- Re: [perfsonar-user] Problem with Persfonar firewall ports, Raul Lopes, 02/24/2020
- Re: [perfsonar-user] Problem with Persfonar firewall ports, Szymon Trocha, 02/24/2020
Archive powered by MHonArc 2.6.19.