Hi Brian,
You indeed are very consistent in your steps. The problem that you have is that you have messed up with source and destination.
It is not clear to me how did you came to the conclusion that the data you are looking at in the MA is indeed about the results from
.e.kenet.or.ke to n.kenet.or.ke.
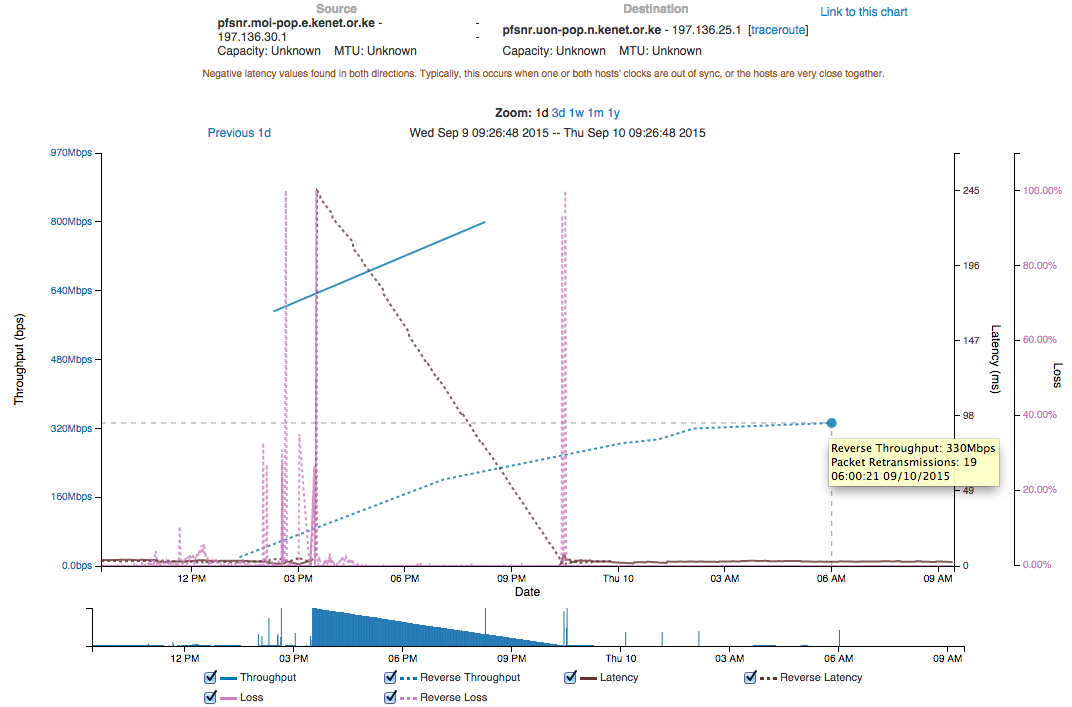
Obviously you are making a mistake by looking at the wrong measurements results. You should read more closely on the details of the results page of the graph (the small window)(the one you have attached). You will see there that it states: reverse throughput
= meaning the measurement results on the reverse from what is on the title of the web page = meaning that these are the results from
.n.kenet.or.ke to e.kenet.or.ke.
The results you should be looking at are with a thick blue line. There you will see the results stated by the Nagios command.
Best regards,
Ivan
From: [mailto:]
On Behalf Of Brian Candler
Sent: Donnerstag, 10. September 2015 09:08
To:
Subject: [perfsonar-user] maddash showing "wrong" values
I have some other issues with maddash but I'll leave those for a separate posting :-)
The most pressing one is that it shows apparently the "wrong" values, and I've traced this down to the output from the Nagios plugin.
Example: maddash shows throughput of 0.700Gbps for throughput from pfsnr.moi-pop.e.kenet.or.ke (197.136.30.1) to pfsnr.uon-pop.n.kenet.or.ke (197.136.25.1)
[root@maddash-uon ~]# /opt/perfsonar_ps/nagios/bin/check_throughput.pl -u
http://pfsnr.moi-pop.e.kenet.or.ke/esmond/perfsonar/archive -w 0.8: -c 0.5: -r 86400 -s pfsnr.moi-pop.e.kenet.or.ke -d pfsnr.uon-pop.n.kenet.or.ke
PS_CHECK_THROUGHPUT WARNING - Average throughput is 0.700Gbps | Count=2;; Min=0.595423;; Max=0.804973;; Average=0.700198;; Standard_Deviation=0.148174225997641;;
But if you look at the graph, the most recent throughput reading is 330Mbps.
http://pfsnr.moi-pop.e.kenet.or.ke/serviceTest/graphWidget.cgi?source=197.136.30.1&dest=197.136.25.1&url="http%3A%2F%2Flocalhost%2Fesmond%2Fperfsonar%2Farchive%2F#timeframe=1d

Now, there are a couple of things to note:
* in the mesh configuration I set "force_bidirectional 0". This adds "send_only 1" to the regular_testing.conf. Therefore the throughput measurement stored on node A is the throughput from A to B only.
This is what we see in the graph above.
* In the maddash gui agent configuration (/opt/perfsonar_ps/mesh_config/etc/gui_agent_configuration.conf) I reduced the check_interval to 1200 (default was 28800, which meant that the dashboard view was up to 8 hours out of date)
However I've removed maddash from the equation by calling the nagios plugin directly.
* So now I want to check the esmond data directly. I don't know if there is an esmond browser; it would be great if there were. But for now I'm just manually reading the JSON:
curl 'http://pfsnr.moi-pop.e.kenet.or.ke/esmond/perfsonar/archive/?format=json' | python -mjson.tool | less
I *believe* the correct archive is this one: the timestamp and value of the most recent value agrees with the graph.
# curl 'http://pfsnr.moi-pop.e.kenet.or.ke/esmond/perfsonar/archive/0c2116fbf85a4b78a7b1b6a8347a6e1c/throughput/base?format=json'
| python -mjson.tool
% Total % Received % Xferd Average Speed Time Time Time Current
Dload Upload Total Spent Left Speed
199 199 0 199 0 0 2445 0 --:--:-- --:--:-- --:--:-- 22111
[
{
"ts": 1441832835, # 2015-09-10 00:07:15 +0300
"val": 287318000.0
},
{
"ts": 1441836453, # 2015-09-10 01:07:33 +0300
"val": 296059000.0
},
{
"ts": 1441840091, # 2015-09-10 02:08:11 +0300
"val": 321768000.0
},
{
"ts": 1441854021, # 2015-09-10 06:00:21 +0300
"val": 334490000.0
}
]
OK, so the latest value is 334Mbps. But why am I seeing 0.700Gbps?
* Now suspicion falls on the "-r" option to the plugin. Is it averaging over a time period?
[root@maddash-uon ~]# /opt/perfsonar_ps/nagios/bin/check_throughput.pl -u
http://pfsnr.moi-pop.e.kenet.or.ke/esmond/perfsonar/archive -w 0.8: -c 0.5: -s pfsnr.moi-pop.e.kenet.or.ke -d pfsnr.uon-pop.n.kenet.or.ke -r 40000
PS_CHECK_THROUGHPUT UNKNOWN - Unable to find any tests with data in the given time range where source is pfsnr.moi-pop.e.kenet.or.ke and destination is pfsnr.uon-pop.n.kenet.or.ke
[root@maddash-uon ~]# /opt/perfsonar_ps/nagios/bin/check_throughput.pl -u
http://pfsnr.moi-pop.e.kenet.or.ke/esmond/perfsonar/archive -w 0.8: -c 0.5: -s pfsnr.moi-pop.e.kenet.or.ke -d pfsnr.uon-pop.n.kenet.or.ke -r 50000
PS_CHECK_THROUGHPUT OK - Average throughput is 0.805Gbps | Count=1;; Min=0.804973;; Max=0.804973;; Average=0.804973;; Standard_Deviation=0;;
[root@maddash-uon ~]# /opt/perfsonar_ps/nagios/bin/check_throughput.pl -u
http://pfsnr.moi-pop.e.kenet.or.ke/esmond/perfsonar/archive -w 0.8: -c 0.5: -s pfsnr.moi-pop.e.kenet.or.ke -d pfsnr.uon-pop.n.kenet.or.ke -r 86000
PS_CHECK_THROUGHPUT WARNING - Average throughput is 0.700Gbps | Count=2;; Min=0.595423;; Max=0.804973;; Average=0.700198;; Standard_Deviation=0.148174225997641;;
But the archive doesn't have any values which could average to 0.700Gbps. And it does have figures which should be within a 50000 second window.
So probably I'm getting mixed up and looking at the wrong archive / the wrong data. However I thought I was being consistent: I was looking at the *moi* archive for the throughput from *moi* to *uon*. Can someone tell me what I'm doing wrong?
Cheers,
Brian.
P.S. I would also like to display (and/or check in Nagios) the *most recent* value from the archive... but I can't see a way to do this.
Looking at -r 86400 I think the value maddash shows is the average over 24 hours. Maybe that's a reasonable thing to do - rather than going red during the day and green overnight for example - but it was not at all obvious to me that was the intentional behaviour.
And if you want to use the plugin to respond quickly to network changes, you probably want the most recent value rather than a long-term average.
