perfsonar-user - [perfsonar-user] maddash showing "wrong" values
Subject: perfSONAR User Q&A and Other Discussion
List archive
- From: Brian Candler <>
- To: "" <>
- Subject: [perfsonar-user] maddash showing "wrong" values
- Date: Thu, 10 Sep 2015 10:08:29 +0300
- Domainkey-signature: a=rsa-sha1; c=nofws; d=pobox.com; h=to:from:subject :message-id:date:mime-version:content-type; q=dns; s=sasl; b=TAI JK9Q1ITVCZ2verUFCDJWl0IVI+sqeWKo0mRxlWdt2kGIjue++yE+v21Fmc01KhAP jjkV3STz3xydJV3ENjkq6UFPtktNJL89ZI500GadlKoyf8Ngw8n+7p+KB+LQOQUj 1xzeuO1xN86CA4fUFjZrqMXw11fA2hitRlihQnms=
|
I have some other issues with maddash but I'll leave those for a
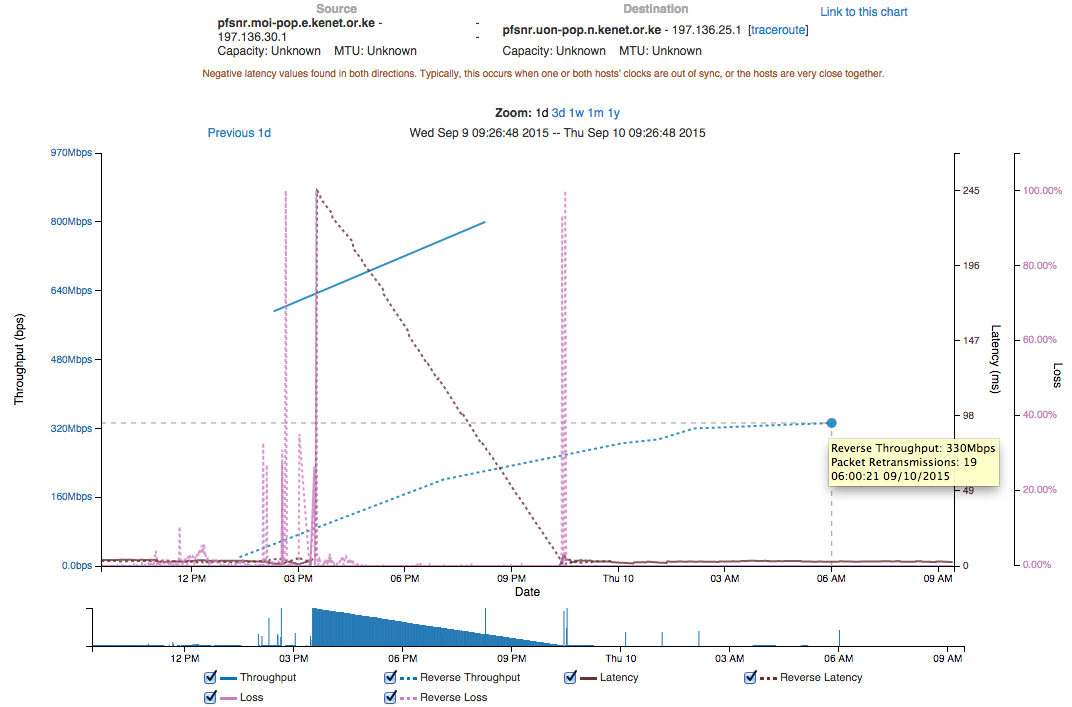
separate posting :-) The most pressing one is that it shows apparently the "wrong" values, and I've traced this down to the output from the Nagios plugin. Example: maddash shows throughput of 0.700Gbps for throughput from pfsnr.moi-pop.e.kenet.or.ke (197.136.30.1) to pfsnr.uon-pop.n.kenet.or.ke (197.136.25.1) [root@maddash-uon ~]# /opt/perfsonar_ps/nagios/bin/check_throughput.pl -u http://pfsnr.moi-pop.e.kenet.or.ke/esmond/perfsonar/archive -w 0.8: -c 0.5: -r 86400 -s pfsnr.moi-pop.e.kenet.or.ke -d pfsnr.uon-pop.n.kenet.or.ke PS_CHECK_THROUGHPUT WARNING - Average throughput is 0.700Gbps | Count=2;; Min=0.595423;; Max=0.804973;; Average=0.700198;; Standard_Deviation=0.148174225997641;; But if you look at the graph, the most recent throughput reading is 330Mbps. http://pfsnr.moi-pop.e.kenet.or.ke/serviceTest/graphWidget.cgi?source=197.136.30.1&dest=197.136.25.1&url="http%3A%2F%2Flocalhost%2Fesmond%2Fperfsonar%2Farchive%2F#timeframe=1d  Now, there are a couple of things to note: * in the mesh configuration I set "force_bidirectional 0". This adds "send_only 1" to the regular_testing.conf. Therefore the throughput measurement stored on node A is the throughput from A to B only. This is what we see in the graph above. * In the maddash gui agent configuration (/opt/perfsonar_ps/mesh_config/etc/gui_agent_configuration.conf) I reduced the check_interval to 1200 (default was 28800, which meant that the dashboard view was up to 8 hours out of date) However I've removed maddash from the equation by calling the nagios plugin directly. * So now I want to check the esmond data directly. I don't know if there is an esmond browser; it would be great if there were. But for now I'm just manually reading the JSON: curl 'http://pfsnr.moi-pop.e.kenet.or.ke/esmond/perfsonar/archive/?format=json' | python -mjson.tool | less I *believe* the correct archive is this one: the timestamp and value of the most recent value agrees with the graph. # curl 'http://pfsnr.moi-pop.e.kenet.or.ke/esmond/perfsonar/archive/0c2116fbf85a4b78a7b1b6a8347a6e1c/throughput/base?format=json' | python -mjson.tool % Total % Received % Xferd Average Speed Time Time Time Current Dload Upload Total Spent Left Speed 199 199 0 199 0 0 2445 0 --:--:-- --:--:-- --:--:-- 22111 [ { "ts": 1441832835, # 2015-09-10 00:07:15 +0300 "val": 287318000.0 }, { "ts": 1441836453, # 2015-09-10 01:07:33 +0300 "val": 296059000.0 }, { "ts": 1441840091, # 2015-09-10 02:08:11 +0300 "val": 321768000.0 }, { "ts": 1441854021, # 2015-09-10 06:00:21 +0300 "val": 334490000.0 } ] OK, so the latest value is 334Mbps. But why am I seeing 0.700Gbps? * Now suspicion falls on the "-r" option to the plugin. Is it averaging over a time period? [root@maddash-uon ~]# /opt/perfsonar_ps/nagios/bin/check_throughput.pl -u http://pfsnr.moi-pop.e.kenet.or.ke/esmond/perfsonar/archive -w 0.8: -c 0.5: -s pfsnr.moi-pop.e.kenet.or.ke -d pfsnr.uon-pop.n.kenet.or.ke -r 40000 PS_CHECK_THROUGHPUT UNKNOWN - Unable to find any tests with data in the given time range where source is pfsnr.moi-pop.e.kenet.or.ke and destination is pfsnr.uon-pop.n.kenet.or.ke [root@maddash-uon ~]# /opt/perfsonar_ps/nagios/bin/check_throughput.pl -u http://pfsnr.moi-pop.e.kenet.or.ke/esmond/perfsonar/archive -w 0.8: -c 0.5: -s pfsnr.moi-pop.e.kenet.or.ke -d pfsnr.uon-pop.n.kenet.or.ke -r 50000 PS_CHECK_THROUGHPUT OK - Average throughput is 0.805Gbps | Count=1;; Min=0.804973;; Max=0.804973;; Average=0.804973;; Standard_Deviation=0;; [root@maddash-uon ~]# /opt/perfsonar_ps/nagios/bin/check_throughput.pl -u http://pfsnr.moi-pop.e.kenet.or.ke/esmond/perfsonar/archive -w 0.8: -c 0.5: -s pfsnr.moi-pop.e.kenet.or.ke -d pfsnr.uon-pop.n.kenet.or.ke -r 86000 PS_CHECK_THROUGHPUT WARNING - Average throughput is 0.700Gbps | Count=2;; Min=0.595423;; Max=0.804973;; Average=0.700198;; Standard_Deviation=0.148174225997641;; But the archive doesn't have any values which could average to 0.700Gbps. And it does have figures which should be within a 50000 second window. So probably I'm getting mixed up and looking at the wrong archive / the wrong data. However I thought I was being consistent: I was looking at the *moi* archive for the throughput from *moi* to *uon*. Can someone tell me what I'm doing wrong? Cheers, Brian. P.S. I would also like to display (and/or check in Nagios) the *most recent* value from the archive... but I can't see a way to do this. Looking at -r 86400 I think the value maddash shows is the average over 24 hours. Maybe that's a reasonable thing to do - rather than going red during the day and green overnight for example - but it was not at all obvious to me that was the intentional behaviour. And if you want to use the plugin to respond quickly to network changes, you probably want the most recent value rather than a long-term average. |
- [perfsonar-user] maddash showing "wrong" values, Brian Candler, 09/10/2015
- RE: [perfsonar-user] maddash showing "wrong" values, Garnizov, Ivan (RRZE), 09/10/2015
- Re: [perfsonar-user] maddash showing "wrong" values, Brian Candler, 09/20/2015
- Re: [perfsonar-user] maddash showing "wrong" values, Brian Candler, 09/20/2015
- Re: [perfsonar-user] maddash showing "wrong" values, Andrew Lake, 09/21/2015
- Re: [perfsonar-user] maddash showing "wrong" values, Brian Candler, 09/21/2015
- Re: [perfsonar-user] maddash showing "wrong" values, Andrew Lake, 09/21/2015
- Re: [perfsonar-user] maddash showing "wrong" values, Brian Candler, 09/20/2015
- Re: [perfsonar-user] maddash showing "wrong" values, Brian Candler, 09/20/2015
- Re: [perfsonar-user] maddash showing "wrong" values, Andrew Lake, 09/10/2015
- Re: [perfsonar-user] maddash showing "wrong" values, Brian Candler, 09/10/2015
- RE: [perfsonar-user] maddash showing "wrong" values, Garnizov, Ivan (RRZE), 09/10/2015
Archive powered by MHonArc 2.6.16.