perfsonar-user - [perfsonar-user] Fwd: bandwidth graph discrepancies
Subject: perfSONAR User Q&A and Other Discussion
List archive
- From: "Roderick Mooi" <>
- To: <>
- Subject: [perfsonar-user] Fwd: bandwidth graph discrepancies
- Date: Fri, 15 Feb 2013 13:33:19 +0200
- Authentication-results: sfpop-ironport07.merit.edu; dkim=neutral (message not signed) header.i=none
Hi all
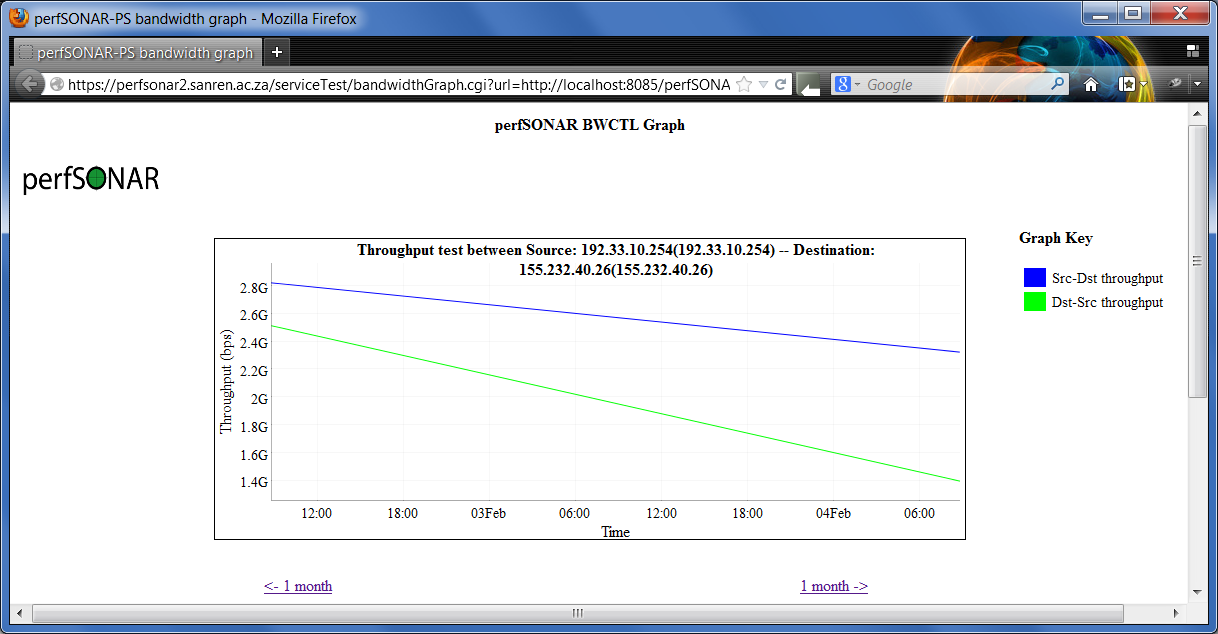
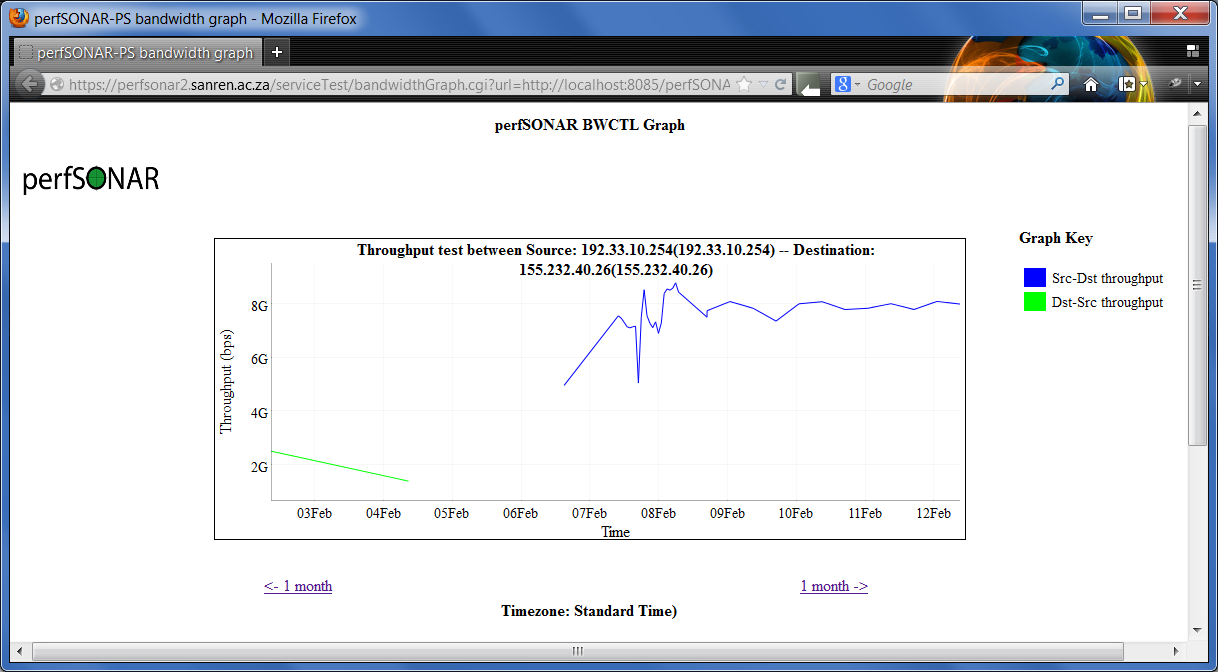
Hopefully someone can help me on this. I thought some of my tests weren't
completing due to the graphs I was getting but then I noticed a strange
anomaly - when changing the Throughput Graph between 1 and 3 months and back
again, I get different results (not just time frame). See attached figures. I
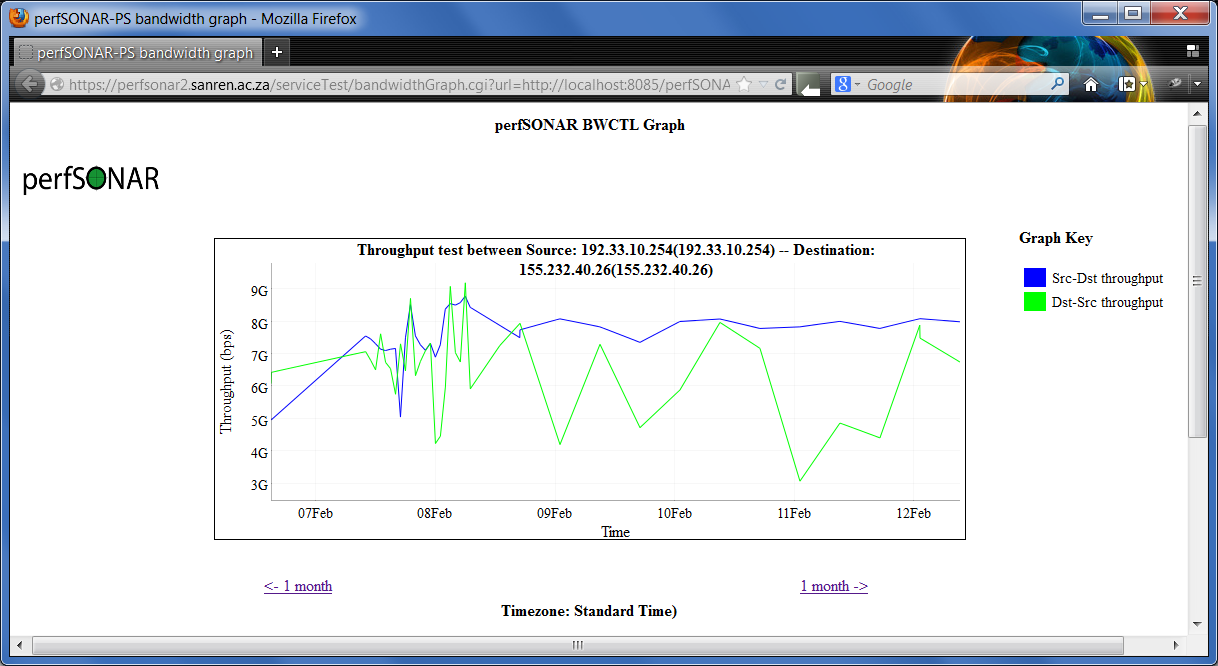
suspect this has something to do with how bandwidthGraph.cgi interprets the
data and draws the graphs but I don't know? PS I think graph3.png is the only
correct one (at least for this week)... The reason I thought tests were
failing was the breaks in src / dest lines and/or the latest date being a few
days ago (and not today) - i.e. results like graph1.png and graph2.png.
Thanks!
Regards,
Roderick Mooi | SANReN Engineer
--
| +27 12 841 4111 | www.sanren.ac.za
--
This message is subject to the CSIR's copyright terms and conditions, e-mail
legal notice, and implemented Open Document Format (ODF) standard.
The full disclaimer details can be found at
http://www.csir.co.za/disclaimer.html.
This message has been scanned for viruses and dangerous content by
MailScanner,
and is believed to be clean.
Please consider the environment before printing this email.
Attachment:
graph1.png
Description: PNG image
Attachment:
graph2.png
Description: PNG image
Attachment:
graph3.png
Description: PNG image
- [perfsonar-user] Fwd: bandwidth graph discrepancies, Roderick Mooi, 02/15/2013
- Re: [perfsonar-user] Fwd: bandwidth graph discrepancies, Sowmya Balasubramanian, 02/15/2013
Archive powered by MHonArc 2.6.16.