perfsonar-user - [perfsonar-user] Issues running tests via Pscheduler and subsequently results are no longer appearing within our PS Dashboard
Subject: perfSONAR User Q&A and Other Discussion
List archive
[perfsonar-user] Issues running tests via Pscheduler and subsequently results are no longer appearing within our PS Dashboard
Chronological Thread
- From: Simon peter green <>
- To:
- Subject: [perfsonar-user] Issues running tests via Pscheduler and subsequently results are no longer appearing within our PS Dashboard
- Date: Sat, 10 Mar 2018 12:06:05 +0800
- Ironport-phdr: 9a23:54Wh5hWPn1LPbL0oz6T+b7jsyIzV8LGtZVwlr6E/grcLSJyIuqrYbReHt8tkgFKBZ4jH8fUM07OQ7/i7HzRYqb+681k6OKRWUBEEjchE1ycBO+WiTXPBEfjxciYhF95DXlI2t1uyMExSBdqsLwaK+i764jEdAAjwOhRoLerpBIHSk9631+ev8JHPfglEnjWwba98IRmssQndqtQdjJd/JKo21hbHuGZDdf5MxWNvK1KTnhL86dm18ZV+7SleuO8v+tBZX6nicKs2UbJXDDI9M2Ao/8LrrgXMTRGO5nQHTGoblAdDDhXf4xH7WpfxtTb6tvZ41SKHM8D6Uaw4VDK/5KptVRTmijoINyQh/W/XlsN/g79VrhGvqRJhxIDZe5uaOOZ7fq7HfdMWWWhMU8BMXCJBGIO8aI4PAvIcM+ZZqon9oF0OpgamBQayGOPg1CVIjWL53a0gzesuDwfG1xEnEtIVsXTUqdL1NKEKUe+r0KnH0y/Db/xM2Tjj9ofIdAssoeqNXbJ2fsre01MvGB3DjlmKr4zqIS+V2v4Ws2iU9udtU/+khWAgqwF0uDevx8Esh5HShoIUzFDE+j92wJwrKt2+UkJ7Z8CrEIdKuyGBOIt6WsEiTHtytCY81LIGpZi2dzUJxpQ/3xPTdf2Kf5SK7x/mWuacIix3iG5gdb+wmxq+7Vavx+jgWcWozVpHqy9InsfSun8QzxDf9NWLR/hn8ku82juC1hrf5v9ZLUwpj6bWKJAsz7gtnZQJq0vDBDX5mEDuga+WaEok/u+o5vziYrr8p5+cM5Z4ihn6Mqgyg8C+Dvo0PhYTUGSB9uS807rj/UL9QLpUlPE5jq7ZsJXCKcQaoK62HRNV35495xu+Ezur0tEVnXcEIV1eZB6KiofkN03SLP/mCPqwn0ignCpuyv3DILHtHIjCImDGkLj7fLZ970BcyBA0zdBa/59UEbABIPf0Wk/3rNzXEAM5PBKuw+boEtVyyJ0RWWSUD6+CMaPSt1CI6fg1I+aSYo8ZojD9JOY55/L0ln85lkcRfbO10psPdHC4AvNmLl2BYXXymNcBH3wKvg04TOPwkl2OSCNTZ22sUKIm/Tw7DIOmDZzfRoC2nrCNxia7HptKZm9YEFCMF2nnd5maV/sWdi2dP9JhwXQ4Uu25RpUvzhaovRW/1qFqNMLV/DEVr5TuyIIz6uHOxj8o8jkhNMWY1GfFV2xok3lASCU70aY39Vd8z1CFyaVkjuZXD9Fe4dtSUwE1PITRyap8Bsy0QQ2XLYTBc0qvXtjzWWJ5ddk22dJbO0s=
Hi all, Currently unable to run tests via pscheduler due to the following error that occurs:
Received the following error when running a reverse test as shown below:
It seems there are issues with the database; I’ve checked pscheduler.log and there are indeed database errors:
Unsure about the first error but for the last one, postgres is running and listening to 5432 on localhost: I am assuming this error is one of the reason why there are no recent tests appearing within our PerfSONAR Dashboard (since Mar 4 2018). Would anyone be able to help me with this issue? Cheers, Simon Green SingAREN PerfSONAR Node details: 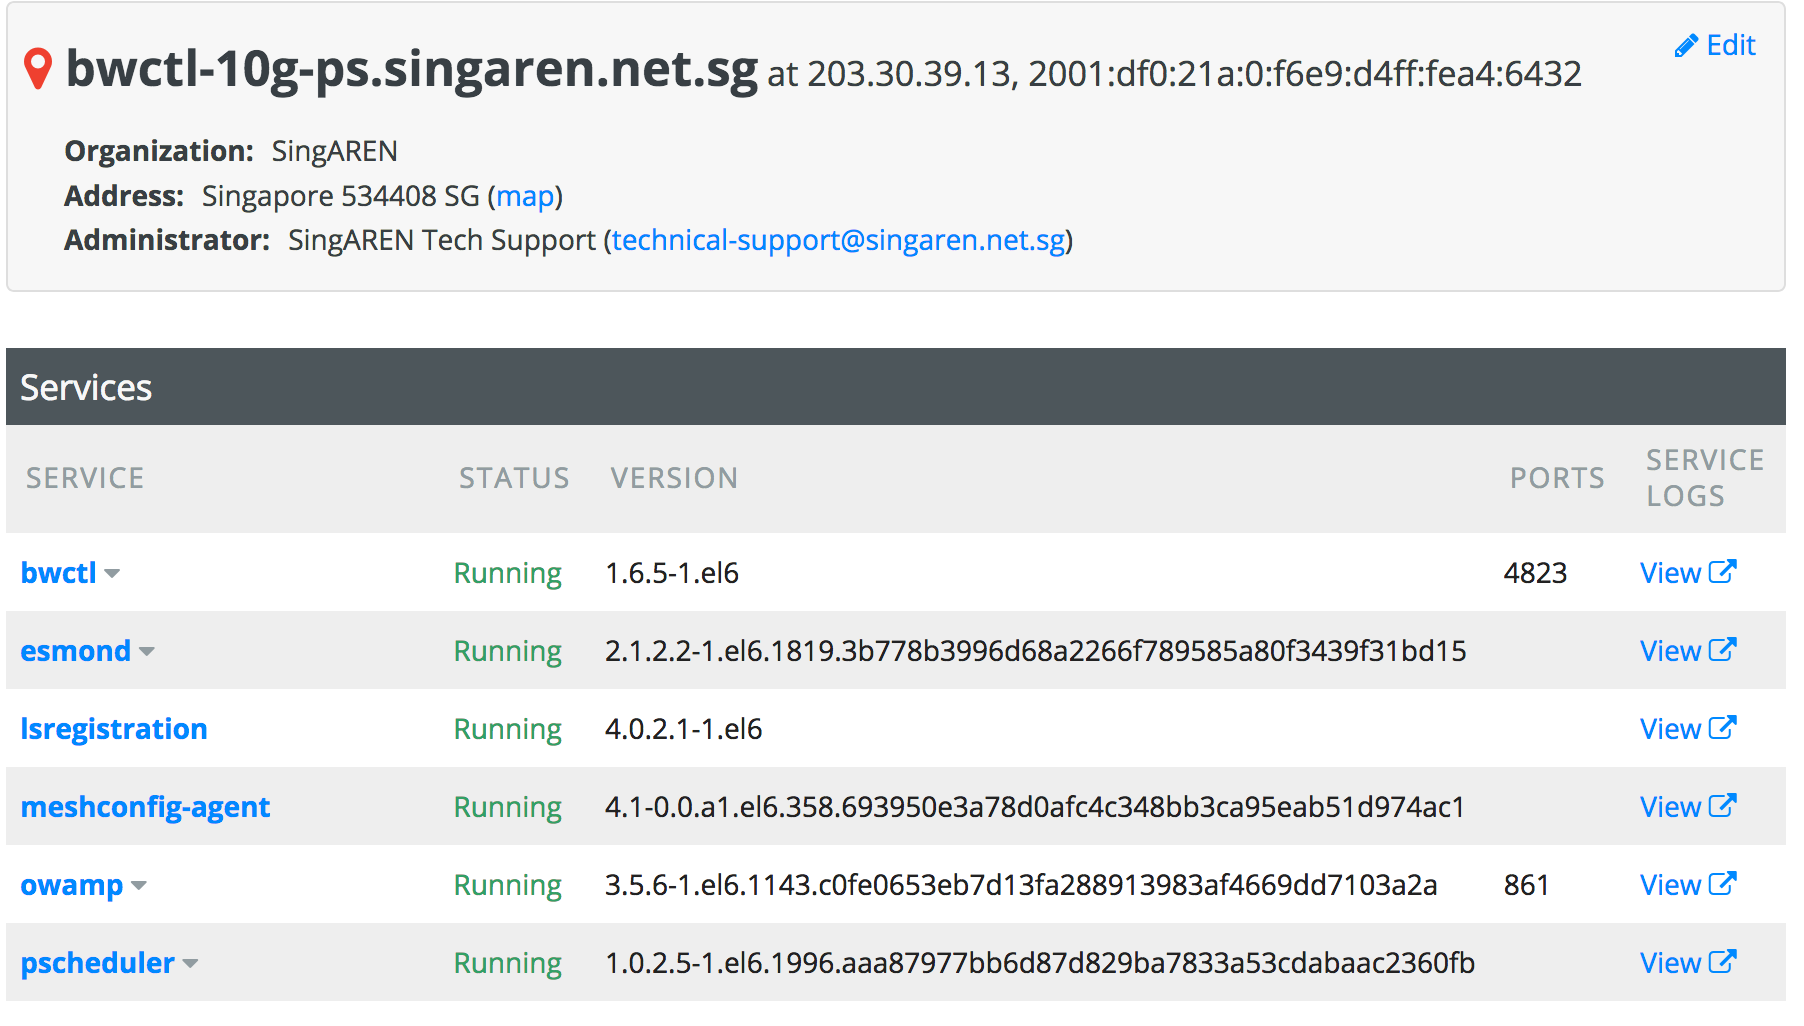 |
- [perfsonar-user] Issues running tests via Pscheduler and subsequently results are no longer appearing within our PS Dashboard, Simon peter green, 03/10/2018
- Re: [perfsonar-user] Issues running tests via Pscheduler and subsequently results are no longer appearing within our PS Dashboard, Valentin Vidic, 03/10/2018
- Re: [perfsonar-user] Issues running tests via Pscheduler and subsequently results are no longer appearing within our PS Dashboard, Simon peter green, 03/10/2018
- Re: [perfsonar-user] Issues running tests via Pscheduler and subsequently results are no longer appearing within our PS Dashboard, Valentin Vidic, 03/10/2018
- Re: [perfsonar-user] Issues running tests via Pscheduler and subsequently results are no longer appearing within our PS Dashboard, Mark Feit, 03/12/2018
- Re: [perfsonar-user] Issues running tests via Pscheduler and subsequently results are no longer appearing within our PS Dashboard, Simon peter green, 03/10/2018
- Re: [perfsonar-user] Issues running tests via Pscheduler and subsequently results are no longer appearing within our PS Dashboard, Valentin Vidic, 03/10/2018
Archive powered by MHonArc 2.6.19.