Dear team,
We have even more doubts as we progress in testing :-)
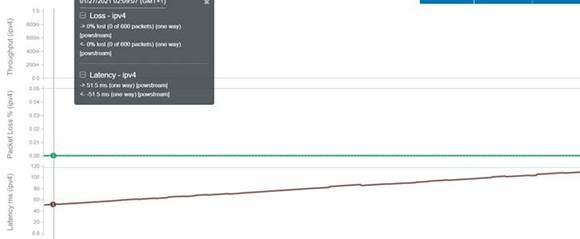
We are seeing the performance of the Perfsonar with TWAMP, and we have seen that it consumes a lot of CPU. We are trying to launch from “machine A” with two test loopbacks to “machine
B” with 50 loopbacks (2x50 test, 100 test)
|
[root@localhost wuivvi01]# top
top - 17:31:18 up 16 days, 17:55, 1 user, load average: 23.88, 23.21, 22.11
Tasks: 398 total, 3 running, 394 sleeping, 0 stopped, 1 zombie
%Cpu0 : 41.8 us, 7.4 sy, 0.0 ni, 6.7 id, 43.8 wa, 0.0 hi, 0.3 si, 0.0 st
%Cpu1 : 71.7 us, 11.3 sy, 0.0 ni, 4.3 id, 12.7 wa, 0.0 hi, 0.0 si, 0.0 st
%Cpu2 : 47.3 us, 7.0 sy, 0.0 ni, 13.0 id, 32.3 wa, 0.0 hi, 0.3 si, 0.0 st
%Cpu3 : 55.5 us, 7.6 sy, 0.0 ni, 9.3 id, 27.2 wa, 0.0 hi, 0.3 si, 0.0 st
KiB Mem : 3880276 total, 1324676 free, 2282156 used, 273444 buff/cache
KiB Swap: 4063228 total, 1251248 free, 2811980 used.
1276284 avail Mem
|
We have the toolkit installed, but it would really be enough for us to launch perfsonar and use esmond to see the data (although ideally, it would be with the kafka mentioned in the
previous email) Is it possible to uninstall a tool to have better results? Our final use would be for 600 one-way tests on a machine (and I think latency is the only test that includes the one-way)
Kin regards,
Victoria Villa Valle | Telefónica Business Solutions
IP Technology – Network Area
Ronda de la Comunicación, s/n
Oeste 3.
Pl. 2, 28050 Madrid, Spain
Móvil: 696911217

De: <>
En nombre de Victoria Villa Valle
Enviado el: jueves, 11 de febrero de 2021 18:50
Para: Garnizov, Ivan <>; Andrew Lake <>;
CC: RUI FERREIRA BERNARDO <>
Asunto: RE: [perfsonar-user] [Multiple question ] Graphing/visualization - Performance - GUI advanced options
AVISO/WARNING: Este mail se ha originado fuera de la organización y no se pudo verificar
al remitente / This mail was originated outside the organization and the sender could not be verified
Dear team,
Thank you very much for your recommendations and explanations, they have helped us to deploy a solution more adapted to our systems.
As we have progressed in the tests, we have seen some things that we could not understand, and we have some questions.
We are using the following template (We had built a more complicated one, but we thought we would start with something more simple):
|
TEST1.json
{
"archives": {
"test-esmond": {
"archiver": "esmond",
"data": {
"url": "https://127.0.0.1/esmond/perfsonar/archive/",
"measurement-agent": "{% scheduled_by_address %}"
}
}
},
"addresses": {
"Maquina_New": { "address": "192.168.140.54" },
"Maquina_Old": { "address": "192.168.140.51" }
},
"groups": {
"example-group-all": {
"type": "mesh",
"addresses": [
{ "name": "Maquina_New" },
{ "name": "Maquina_Old" }
]
}
},
"tests": {
"owamp_test": {
"type": "latency",
"spec": {
"source": "{% address[0] %}",
"dest": "{% address[1] %}",
"packet-count": 2
}
}
},
"schedules": {
"Test_10s": {
"repeat": "PT15S",
"sliprand": false,
"slip": "PT2S"
}
},
"tasks": {
"Prueba_New_Old": {
"group": "example-group-all",
"test": "owamp_test",
"schedule": "Test_10s",
"archives": [ "test-esmond" ]
}
}
}
|
We have loaded it in the following way:
QUESTIONS:
1) We observe that the tests are launched more than once in the time interval (the same test being sent 6 times) What is this behavior due to?:
2) Where can we check the result of the one-way? We have located histogram-owdelay/packet-count-lost/packet-count-send data in esmond-archive, but none of them have the one-way (or we have not been able to interpret it)
3) We have tried to send the configuration to a
kafka (to which we have connection) changing the file to the following configuration, but we have not seen anything come out of the device ... Do we have to change anything else?
|
"archives": {
"test-esmond": {
"archiver": "kafka",
"data": {
"topic": "perfsonar",
"server-address": "192.168.142.217:9092"
}
}
}
|
4) Is there a project to support the file with Kinesis (AWS) data collector?
An example of kinesis data needed:
|
[[outputs.kinesis]]
region = "eu-central-X"
endpoint_url = "https:X
# endpoint_url = "https://X"
access_key = "AAAAAAAAAA"
secret_key = "AAAAAAAAAA"
streamname = " telemetry-test01"
partitionkey = "PartitionKey"
use_random_partitionkey = false
data_format = "json"
|
Again, thank you very much for your help and support.
Kind regards,
Victoria Villa Valle | Telefónica Global Solutions
IP Technology – Network Area
Ronda de la Comunicación, s/n
Oeste 3.
Pl. 2, 28050 Madrid, Spain
Móvil: 696911217
De: Garnizov, Ivan <>
Enviado el: viernes, 29 de enero de 2021 18:07
Para: Victoria Villa Valle <>; Andrew Lake <>;
Asunto: RE: [perfsonar-user] [Multiple question ] Graphing/visualization - Performance - GUI advanced options
Hello Victoria,
Here is about pSconfig:
https://docs.perfsonar.net/psconfig_intro.html (1)
In the subsections:
https://docs.perfsonar.net/psconfig_templates_intro.html#real-world-example
pSConfig the service, which runs on the pS nodes, reads the JSON mesh config and then generates automatically the tests… picture of (1)
The data in principle / general approach / is sent to Esmond: pS measurement archive. This service has its API:
https://docs.perfsonar.net/esmond_api_rest.html?highlight=esmond
Alternatively to Esmond you could send the test results in another MA:
https://docs.perfsonar.net/pscheduler_ref_archivers.html?highlight=esmond
„To avoid space problems, I understand that We can do it installing only the testpoint
and avoid the issue of data storage“ …. Exactly
Disable storage on Toolkit should mean you just make sure there are no locally generated tasks… just use pSconfig the way specified above.
A guide for Testpoint? Perhaps you mean this:
https://docs.perfsonar.net/install_centos.html or this
https://docs.perfsonar.net/install_debian.html
Regards,
Ivan Garnizov
GEANT WP6T3: pS development team
GEANT WP7T1: pS deployments GN Operations
GEANT WP9T2: Software governance in GEANT
From: Victoria Villa Valle []
Sent: Friday, January 29, 2021 10:46 AM
To: Andrew Lake <>; ; Garnizov, Ivan (RRZE) <>
Subject: RE: [perfsonar-user] [Multiple question ] Graphing/visualization - Performance - GUI advanced options
Hello Andrew, Ivan,
Thank you very much for the quick answer.
With psconfig I can generate multiple tests automatically? Which API can then consume this data? Is there a guide?
I have seen APIs that touch the data, but it is not clear to me how I could consume the data from another environment.
To avoid space problems, I understand that We can do it installing only the testpoint and avoid the issue of data storage (being able to send it to an external
manager, like ELK). Is there a way to disable the storage and be in the Toolkit or we need to re-install just the “testpoint”? Is there any guide to follow the use of the "testpoint"?
Kind regards,
Victoria Villa Valle | Telefónica Business Solutions
IP Technology – Network Area
Ronda de la Comunicación, s/n
Oeste 3.
Pl. 2, 28050 Madrid, Spain
Móvil: 696911217
De: Andrew Lake <>
Enviado el: miércoles, 27 de enero de 2021 17:03
Para: ; Garnizov, Ivan <>; Victoria Villa Valle <>
Asunto: RE: [perfsonar-user] [Multiple question ] Graphing/visualization - Performance - GUI advanced options
On January 27, 2021 at 10:43:20 AM, Garnizov, Ivan () wrote:
Hello Victoria,
Your questions are actually not that simple / basic.
1) The
GUI you refer to is actually part of the pS Toolkit bundle, which is actually the most sophisticated solution we provide. The Toolkit solution incorporates almost all of the features of the pS ecosystem. It is designed to ease the use and hide the complexity
behind interdependent services.
Still if you are looking for all the options of the pS solutions, then you’d better consider the core pS components and customize the pS framework to your needs.
To add to this is that the GUI can currently only take you so far and there are a whole bunch of options perfSONAR allows you too set that are not available in the UI. All of the tests are
defined in a JSON file we refer to as pSConfig templates (or often call a “mesh file”). More details on that process can be found here: http://docs.perfsonar.net/#managing-multiple-hosts-with-psconfig.
There is also a more advanced GUI for defining tests here: http://docs.perfsonar.net/pwa.html
2) Refer
to point 1 and you’ll understand why the pS Toolkit system is so resource hungry. I am not sure what you mean with “limitations regarding performance”.
We do not set limits for the operation of pS services. Actually perfSONAR pS is just the orchestrator of many popular tools for network performance testing. We do not manipulate or limit these tools by any means.
RAM is always the first thing to go, and 4GB is the minimum we suggest. The biggest user of resources is the database that stores the results. This is why many people run the “testpoint” bundle
that does not include local storage and send results to a central server.
3) There
is no official support for Grafana from pS dev team yet… I am not sure we are going to provide ever such. Still we are working towards opening the pS services to be able to provision data-analysis stacks based on ELK, which also includes Grafana, but we are
not there yet.
Just to reiterate, we are moving toward this but are not there yet.
Regards,
Ivan Garnizov
GEANT WP6T3: pS development team
GEANT WP7T1: pS deployments GN Operations
GEANT WP9T2: Software governance in GEANT
From:
[mailto:] On Behalf Of Victoria Villa Valle
Sent: Wednesday, January 27, 2021 2:01 PM
To:
Subject: [perfsonar-user] [Multiple question ] Graphing/visualization - Performance - GUI advanced options
Good morning,
We are starting with a migration project from Cisco IPSLA to another type of Software, and one of the options we have been working with for a few months is Perfsonar since being an open source tool with several possibilities (not only IPSLA measurement) it
can be used as an evolution of Cisco's legacy tools.
We are starting with tests that report the jitter to us, specifically the icmp jitter and the TWAMP that we see that the tool has (We do not know if there may be any that report the one-way as well as the udp-jitter other than the TWAMP in Perfsonar). We are
doing the tests between two ubuntu servers with Perfsonar installed.
With these tests, and as new users, we have different doubts :
1) Is possible via GUI configure more “Advanced options” (like DSCP) . We just see the packet rate and size . Is there a different GUI that includes more options?
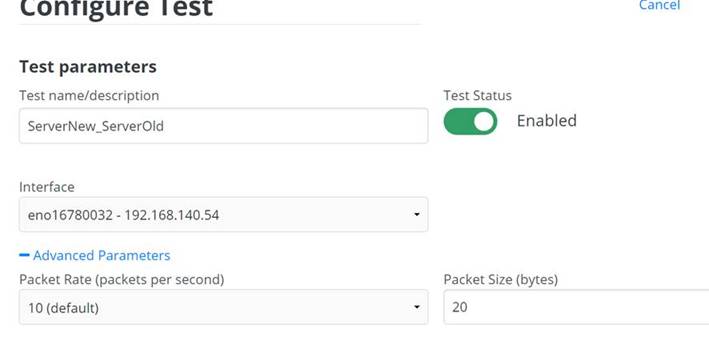
2) Our network is made up of many devices, requiring 80K tests (120 probes with 6 different QoS meshed
together). Running a single test ( the one shown above) we see that the device suffers in terms of RAM (the equipment is dedicated only for these tests). Are there any limitations regarding performance? Is there a test on how much a Perfsonar agent supports?
Sometimes the CPU usage is 1.5%

3) We have seen that in the latest versions of Perfsonar support for Grafana has been added. Would
this be the best way to attack this data? Is there any guide for collecting API data?
Sorry if they are very basic questions, but we have not found very clear solutions to them, and being
new users we are a bit stuck with it.
Kind regards,
Victoria Villa Valle | Telefónica Business Solutions
IP Technology – Network Area
Ronda de la Comunicación, s/n
Oeste 3. Pl.
2, 28050 Madrid, Spain
Móvil: 696911217
Este mensaje y sus adjuntos se dirigen exclusivamente a su destinatario, puede contener información privilegiada o confidencial y es para uso exclusivo de la persona o entidad de destino. Si no es usted. el destinatario indicado, queda notificado de que la
lectura, utilización, divulgación y/o copia sin autorización puede estar prohibida en virtud de la legislación vigente. Si ha recibido este mensaje por error, le rogamos que nos lo comunique inmediatamente por esta misma vía y proceda a su destrucción.
The information contained in this transmission is privileged and confidential information intended only for the use of the individual or entity named above. If the reader of this message is not the intended recipient, you are hereby notified that any dissemination,
distribution or copying of this communication is strictly prohibited. If you have received this transmission in error, do not read it. Please immediately reply to the sender that you have received this communication in error and then delete it.
Esta mensagem e seus anexos se dirigem exclusivamente ao seu destinatário, pode conter informação privilegiada ou confidencial e é para uso exclusivo da pessoa ou entidade de destino. Se não é vossa senhoria o destinatário indicado, fica notificado de que a
leitura, utilização, divulgação e/ou cópia sem autorização pode estar proibida em virtude da legislação vigente. Se recebeu esta mensagem por erro, rogamos-lhe que nos o comunique imediatamente por esta mesma via e proceda a sua destruição
--
To unsubscribe from this list:
https://lists.internet2.edu/sympa/signoff/perfsonar-user
Este mensaje y sus adjuntos se dirigen exclusivamente a su destinatario, puede contener información privilegiada o confidencial y es para uso exclusivo de la persona o entidad de destino. Si no es usted. el destinatario indicado, queda notificado de que la
lectura, utilización, divulgación y/o copia sin autorización puede estar prohibida en virtud de la legislación vigente. Si ha recibido este mensaje por error, le rogamos que nos lo comunique inmediatamente por esta misma vía y proceda a su destrucción.
The information contained in this transmission is privileged and confidential information intended only for the use of the individual or entity named above. If the reader of this message is not the intended recipient, you are hereby notified that any dissemination,
distribution or copying of this communication is strictly prohibited. If you have received this transmission in error, do not read it. Please immediately reply to the sender that you have received this communication in error and then delete it.
Esta mensagem e seus anexos se dirigem exclusivamente ao seu destinatário, pode conter informação privilegiada ou confidencial e é para uso exclusivo da pessoa ou entidade de destino. Se não é vossa senhoria o destinatário indicado, fica notificado de que a
leitura, utilização, divulgação e/ou cópia sem autorização pode estar proibida em virtude da legislação vigente. Se recebeu esta mensagem por erro, rogamos-lhe que nos o comunique imediatamente por esta mesma via e proceda a sua destruição
|