Hi Brian,
If there was an outage meaning it couldn’t even talk to OWAMPD on the other side at port 861 then you won't get any test results. If OWAMP can’t even connect to port 861 it can't do things like choose the UDP ports or exchange results, so it would be incorrect to label that as 100% packet loss since it didn't send any packets. The only time you get 100% packet loss is if the OWAMP client can connect to port 861 on the remote end to establish a session and get the UDP ports for the test, and then it loses all the UDP packets (usually a firewall causes that). It’s possible we could display these gaps better, but the reporting is working as expected in the face of a hard failure like you describe.
Thanks, Andy
On November 16, 2017 at 9:26:53 AM, Brian Candler () wrote:
I have a collection of NUC perfsonar nodes, with auto-updates
enabled, and the web interface says they are running 4.0.1-1.el6.
They are running a standard set of owamp and throughput tests
between them, across some site-to-site private links and
VPNs.
What I have noticed several times recently is that if there's a
network outage, where I'd expect packet loss graph to shoot up to
100%, it just stays frozen at whatever the previous measured value
was.
If I happen to know the time of the network outage, and hover
forward and backward over that time period in the GUI, I see that
the owamp throughput is exactly static over that period, whereas
normally it varies up and down due to clock instabilities.
That's a hint that data collection has stopped, but otherwise there
is no indication of an outage; in particular there's no red dot for
a failed test. So I can't see, just by looking at the graph,
that anything was wrong at all.
I thought this used to work before - i.e. I'd see packet loss at
100% during an outage.
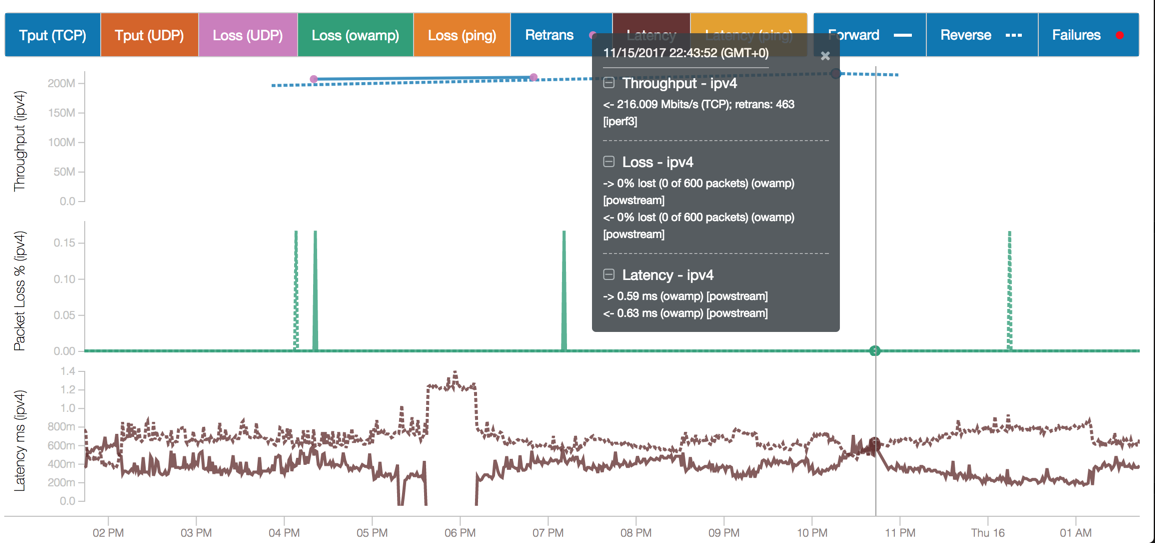
As a concrete example, there was a planned outage last night around
22:44-22:51 (while I was rebooting a firewall), but during that
time no loss is shown in perfsonar. Moving the pointer back
and forth between those times shows the latency fixed at 0.59ms /
0.63ms, whereas outside of those times it varies. Packet loss
is 0% both before and after that period, so I have no way to tell
that there are missing data points.
Looking at esmond, you can see the gap in the owamp data, normally
recorded at 60 second intervals:
$ curl ' http://x.x.x.x/esmond/perfsonar/archive/6f346aaf193c488384a3e869c936ff9e/histogram-owdelay/base?time-start=1510785600&time-end=1510786500'
| python -mjson.tool | grep '"ts"'
"ts": 1510785630,
"ts": 1510785690,
"ts": 1510785750,
"ts":
1510785810, => 2017-11-15 22:43:30 +0000
"ts":
1510786347, => 2017-11-15 22:52:27 +0000
"ts": 1510786407,
"ts": 1510786467,
Now, if no latency can be measured, it's probably reasonable not to
store anything. BUT: I get the same gap in the packet loss
data too:
$ curl ' http://ix-perf2.int.soundmouse.net/esmond/perfsonar/archive/6f346aaf193c488384a3e869c936ff9e/packet-loss-rate/base?time-start=1510785600&time-end=1510786500'
| python -mjson.tool
[
{
"ts": 1510785630,
"val": 0.0
},
{
"ts": 1510785690,
"val": 0.0
},
{
"ts": 1510785750,
"val": 0.0
},
{
"ts":
1510785810, => 2017-11-15 22:43:30 +0000
"val": 0.0
},
{
"ts":
1510786347, => 2017-11-15 22:52:27 +0000
"val": 0.0
},
{
"ts": 1510786407,
"val": 0.0
},
{
"ts": 1510786467,
"val": 0.0
}
]
So there's the problem: it's showing me 0% packet loss, then a big
gap, then more 0% packet loss. I was expecting one bin of
1-99% packet loss, then a series of bins of 100% loss, then a final
bin of 1-99% packet loss.
The fact that the database isn't storing any data, is compounded by
the fact that the GUI doesn't show that there is missing data - it
just joins the dots between whatever data points it has.
Note that neither of the perfsonar nodes themselves were rebooted -
it was just one of the firewalls in between them which caused the
lack of connectivity. Just to prove this:
[brian@ix-perf2 ~]$ uptime
14:01:56 up 460 days, 58 min, 1 user, load
average: 0.17, 0.23, 0.25
[brian@lch-perf2 ~]$ uptime
14:02:14 up 355 days, 18:46, 1 user, load
average: 0.31, 0.39, 0.39
Aside: over a year and no reboot due to kernel security
upgrade?? That's a bit suspicious I think.
[brian@lch-perf2 ~]$ uname -a
Linux lch-perf2.int.soundmouse.net
2.6.32-642.11.1.el6.web100.x86_64 #1 SMP Mon Nov 21 06:54:09 PST
2016 x86_64 x86_64 x86_64 GNU/Linux
[brian@lch-perf2 ~]$ rpm -qa | grep kernel-2
kernel-2.6.32-696.10.2.el6.x86_64
kernel-2.6.32-642.11.1.el6.web100.x86_64
kernel-2.6.32-696.16.1.el6.x86_64
kernel-2.6.32-696.10.3.el6.x86_64
kernel-2.6.32-696.13.2.el6.x86_64
Maybe none of those updates was a *mandatory* reboot. But it
looks like I'm still running a 1y+ old kernel, so maybe I should
reboot the nodes anyway. (Maybe I should also reinstall them
with CentOS 7, but that's a separate issue, and a big job)
In owamp_bwctl.log I have:
Nov 15 22:39:37 ix-perf2 bwctld[21215]: FILE=sapi.c, LINE=391,
BWLControlAccept(): Unable to read
ClientGreeting
message
Nov 15 22:39:38 ix-perf2
bwctld[21219]: FILE=sapi.c, LINE=391, BWLControlAccept(): Unable to
read ClientGreeting message
Nov 15 22:39:46
ix-perf2 bwctld[21238]: FILE=sapi.c, LINE=391, BWLControlAccept():
Unable to read ClientGreeting message
Nov
15 22:39:48 ix-perf2 bwctld[21256]: FILE=sapi.c, LINE=391,
BWLControlAccept(): Unable to read ClientGreeting
message
Nov 15 22:39:50 ix-perf2
bwctld[21260]: FILE=sapi.c, LINE=391, BWLControlAccept(): Unable to
read ClientGreeting message
Nov 15 22:39:51
ix-perf2 bwctld[21297]: FILE=sapi.c, LINE=391, BWLControlAccept():
Unable to read ClientGreeting message
Nov
15 22:39:53 ix-perf2 bwctld[21323]: FILE=sapi.c, LINE=391,
BWLControlAccept(): Unable to read ClientGreeting
message
Nov 15 22:39:53 ix-perf2
bwctld[21341]: FILE=sapi.c, LINE=391, BWLControlAccept(): Unable to
read ClientGreeting message
Nov 15 22:39:58
ix-perf2 bwctld[21376]: FILE=sapi.c, LINE=391, BWLControlAccept():
Unable to read ClientGreeting message
Nov
15 22:39:59 ix-perf2 bwctld[21390]: FILE=sapi.c, LINE=391,
BWLControlAccept(): Unable to read ClientGreeting
message
Nov 15 22:50:12 ix-perf2
owampd[23325]: FILE=protocol.c, LINE=1900, _OWPWriteStopSessions:
called in wrong state.
Nov 15 22:50:12
ix-perf2 owampd[23325]: FILE=owampd.c, LINE=806, Control session
terminated abnormally...
Nov 15 22:50:27
ix-perf2 owampd[23358]: FILE=protocol.c, LINE=1900,
_OWPWriteStopSessions: called in wrong state.
Nov 15 22:50:27 ix-perf2 owampd[23358]: FILE=owampd.c,
LINE=806, Control session terminated
abnormally...
Nov 15 22:51:14 ix-perf2
bwctld[23599]: FILE=sapi.c, LINE=391, BWLControlAccept(): Unable to
read ClientGreeting message
Nov 15 22:51:17
ix-perf2 bwctld[23548]: FILE=endpoint.c, LINE=1310, PeerAgent: Peer
cancelled test before expected
Nov 15
22:51:22 ix-perf2 bwctld[23646]: FILE=protocol.c, LINE=247,
I2Readni(): Connection reset by peer
Nov 15
22:51:22 ix-perf2 bwctld[23646]: FILE=sapi.c, LINE=391,
BWLControlAccept(): Unable to read ClientGreeting
message
Nov 15 22:51:28 ix-perf2
bwctld[23647]: FILE=protocol.c, LINE=247, I2Readni(): Connection
reset by peer
Nov 15 22:51:28 ix-perf2
bwctld[23647]: FILE=sapi.c, LINE=391, BWLControlAccept(): Unable to
read ClientGreeting message
Nov 15 22:51:32
ix-perf2 bwctld[23667]: FILE=sapi.c, LINE=391, BWLControlAccept():
Unable to read ClientGreeting message
Nov
15 22:51:36 ix-perf2 bwctld[23670]: FILE=protocol.c, LINE=247,
I2Readni(): Connection reset by peer
Nov 15
22:51:36 ix-perf2 bwctld[23670]: FILE=sapi.c, LINE=391,
BWLControlAccept(): Unable to read ClientGreeting
message
Nov 15 22:52:39 ix-perf2
bwctld[23834]: FILE=protocol.c, LINE=247, I2Readni(): Connection
reset by peer
Nov 15 22:52:39 ix-perf2
bwctld[23834]: FILE=sapi.c, LINE=391, BWLControlAccept(): Unable to
read ClientGreeting message
Nov 15 22:53:43
ix-perf2 bwctld[24115]: FILE=protocol.c, LINE=247, I2Readni():
Connection reset by peer
Nov 15 22:53:43
ix-perf2 bwctld[24115]: FILE=sapi.c, LINE=391, BWLControlAccept():
Unable to read ClientGreeting message
Nov
15 22:54:47 ix-perf2 bwctld[24404]: FILE=protocol.c, LINE=247,
I2Readni(): Connection reset by peer
Nov 15
22:54:47 ix-perf2 bwctld[24404]: FILE=sapi.c, LINE=391,
BWLControlAccept(): Unable to read ClientGreeting
message
Nov 15 22:59:44 ix-perf2
owampd[21938]: FILE=owampd.c, LINE=806, Control session terminated
abnormally...
Nov 15 22:59:49 ix-perf2
owampd[21962]: FILE=owampd.c, LINE=806, Control session terminated
abnormally...
Nov 15 23:00:16 ix-perf2
owampd[22144]: FILE=owampd.c, LINE=806, Control session terminated
abnormally...
Nov 15 23:00:32 ix-perf2
owampd[22147]: FILE=owampd.c, LINE=806, Control session terminated
abnormally...
Nov 15 23:00:35 ix-perf2
owampd[22170]: FILE=owampd.c, LINE=806, Control session terminated
abnormally...
Nov 15 23:01:14 ix-perf2
owampd[22305]: FILE=owampd.c, LINE=806, Control session terminated
abnormally...
Nov 15 23:01:24 ix-perf2
bwctld[25995]: FILE=sapi.c, LINE=391, BWLControlAccept(): Unable to
read ClientGreeting message
Nov 15 23:02:14
ix-perf2 bwctld[26224]: FILE=sapi.c, LINE=391, BWLControlAccept():
Unable to read ClientGreeting message
(the bwctl errors seem to be fairly regular even when the network
is up). I think I have all necessary firewall ports open,
because in any case when the network is up all the tests are
fine.
Does anyone else have similar experience? Is this expected
behaviour, or is there anything I can do to help improve
this?
Thanks,
Brian Candler.
|