perfsonar-dev - Re: ***SPAM*** Re: [pS-dev] pUI strange bahaviour
Subject: perfsonar development work
List archive
- From: Szymon Trocha <>
- To: perfsonar-dev <>
- Subject: Re: ***SPAM*** Re: [pS-dev] pUI strange bahaviour
- Date: Mon, 02 Jul 2007 13:53:45 +0200
Nina,
Nina Jeliazkova wrote:
Hello Szymon,
We have analyzed the problems you’ve reported and came to the following
conclusions:
First of all thank you for your thorough investigation.
1) N/A values in perfsonarUI’s summary table and bar chart (when data is
actually available in the service) are most probably due to an unresolved
issue either in client/server side Axis or in the RRD MA service itself. The
problem is occurring whenever aggregated and/or parallel requests are sent
through Axis calls and is more frequently exhibited when more queries are
aggregated in a single Axis call. The N/A values correspond to broken strings
(e.g. for eventType or other query parameters), reported by the service:
<nmwg:data id="resultDescriptionData_for_resultCodeMetadata_22"
metadataIdRef="resultCodeMetadata_22">
<nmwgr:datum
xmlns:nmwgr="http://ggf.org/ns/nmwg/result/2.0/";>MetadataQueryGeneratorFactory.getMetadataQueryGenerator:
eventType f.org/ns/nmwg/characteristic/utilization/2.0 is not
supported</nmwgr:datum>
</nmwg:data>
This happens for random interfaces and random positions in the parameter
strings. However, perfsonarUI sends the correct strings in its queries,
regardless if they’re aggregated, parallel or simple. As a workaround we have
reduced the default level of query aggregation from 32 to 8 interfaces which
mitigates the issue for PIONIER RRD MA. However, even with these more
conservative settings some erroneous N/A values are reported by GEANT RRD MA,
illustrating the fact that the problem depends on other factors as well (e.g.
number of available interfaces in a given RRD MA, load of the RRD MA, etc). We
have reproduced the above problem with the Python client as well, which points
to the server side Axis or the RRD MA service itself as the culprit, because
the Python client doesn’t use client side Axis and moreover is a completely
independent client implementation.
Did it happen before? I don't remember someone reported it (but I may be wrong)
Roman - could you investigate it where the problem could be located within the service and how we can fix it?
2) PIONIER’s RRD MA contains one interface with no utilization data associated[...]
(so the reported N/A values are expected):
OK. That's clear
3) PIONIER’s RRD MA contains one interface which is defined in a different way[...]
for in/out directions:
Thanks for pointing it out. I will correct it.
4) We have fixed perfsonarUI’s utilization graph at the bottom to report
trailing NaNs as Null rather than 0, which results in the behaviour you’ve
suggested.
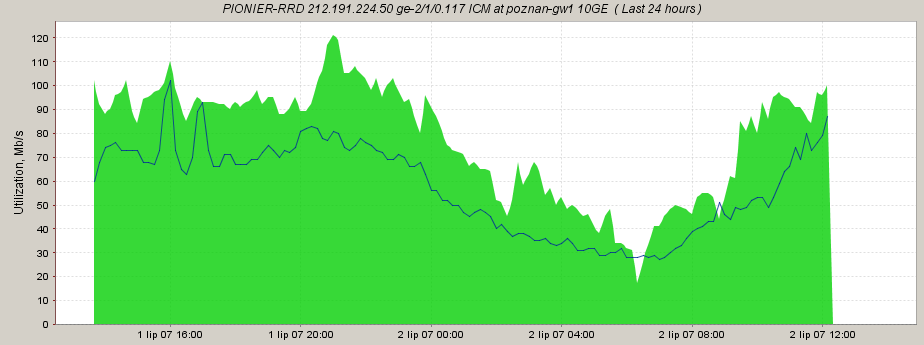
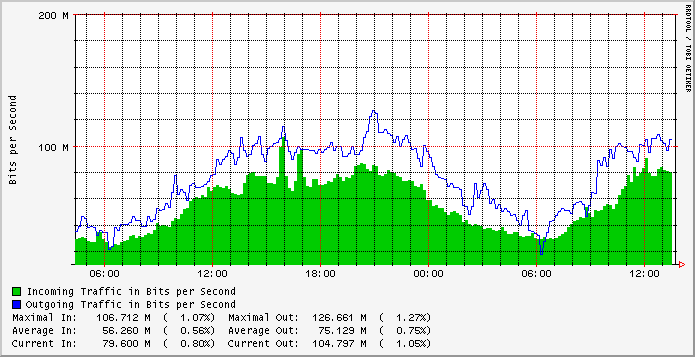
I think it's better now but I had in mind something different. See two attached pictures: one from MRTG and one from psUI. In psUI the graph ends suddenly before the end of the right edge leaving a few cm of white space (similarly on the right edge). To me it looks like holes in data. On the other hand in MRTG the graph is to the very left and right end which looks more natural.
But this is only my personal opinion and maybe I'm too much used to MRTG :) I don't know if it's possible to "fit" the graph in the window and what the others think or what is more useful for them.
Best regards,
--
Szymon Trocha
Poznan Supercomputing & Ntw. Center ::: NETWORK OPERATION CENTER
Tel. (+48 61) 8582022
http://noc.man.poznan.pl ::: http://noc.pionier.gov.pl
- Re: [pS-dev] pUI strange bahaviour, Szymon Trocha, 07/02/2007
- <Possible follow-up(s)>
- Re: [pS-dev] pUI strange bahaviour, Nina Jeliazkova, 07/02/2007
- Re: ***SPAM*** Re: [pS-dev] pUI strange bahaviour, Szymon Trocha, 07/02/2007
- Re: ***SPAM*** Re: [pS-dev] pUI strange bahaviour, Nina Jeliazkova, 07/02/2007
- Re: ***SPAM*** Re: [pS-dev] pUI strange bahaviour, Szymon Trocha, 07/02/2007
- Re: ***SPAM*** Re: [pS-dev] pUI strange bahaviour, Loukik Kudarimoti, 07/02/2007
- Re: ***SPAM*** Re: [pS-dev] pUI strange bahaviour, Szymon Trocha, 07/02/2007
- Re: ***SPAM*** Re: [pS-dev] pUI strange bahaviour, Loukik Kudarimoti, 07/02/2007
- Re: ***SPAM*** Re: [pS-dev] pUI strange bahaviour, Szymon Trocha, 07/02/2007
- Re: ***SPAM*** Re: [pS-dev] pUI strange bahaviour, Roman Lapacz, 07/03/2007
- Re: pUI strange bahaviour -- NMWG parser bug fix and XFire, Maciej Glowiak, 07/03/2007
- Re: [pS-dev] Re: pUI strange bahaviour -- NMWG parser bug fix and XFire, Szymon Trocha, 07/03/2007
- Re: [pS-dev] Re: pUI strange bahaviour -- NMWG parser bug fix and XFire, Maciej Glowiak, 07/03/2007
- Re: [pS-dev] Re: pUI strange bahaviour -- NMWG parser bug fix and XFire, Szymon Trocha, 07/03/2007
- Re: pUI strange bahaviour -- NMWG parser bug fix and XFire, Maciej Glowiak, 07/03/2007
- Re: ***SPAM*** Re: [pS-dev] pUI strange bahaviour, Nina Jeliazkova, 07/02/2007
- Re: ***SPAM*** Re: [pS-dev] pUI strange bahaviour, Szymon Trocha, 07/02/2007
Archive powered by MHonArc 2.6.16.

